Citizen Bull’s recent Breeders’ Cup Juvenile victory highlights a compelling breeding pattern. It represents one of Into Mischief’s eleven stakes winners from Distorted Humor mares. Respected bloodstock analysts Sid Fernando and Frances Karon note that this 14% stakes winner rate (versus Into Mischief’s overall 9%) makes sceptics of nicking “stare at the floor when asked to explain these numbers.” Yet this observation, while intriguing, demands rigorous statistical analysis.
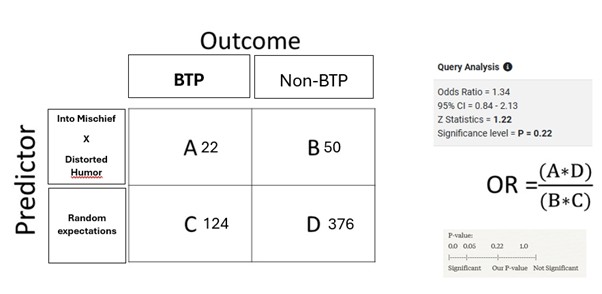
Our examination of the direct Into Mischief x Distorted Humor cross reveals 72 racing-age offspring, producing 22 Black Type Performers, including G1 winners Life Is Good and Practical Joke. The 30.6% success rate appears impressive, yet statistical analysis tells a more nuanced story. Compared to a random sample of similarly bred horses – accounting for the quality level of both sire and dam – this pattern shows an Odds Ratio of 1.34. While this suggests horses bred on this pattern are 34% more likely to achieve black-type performance than expected given their breeding, two critical statistical measures indicate this could be random chance. The confidence interval of 0.84-2.13 crossing 1.0 means we cannot rule out that there’s no effect at all, while the P-value of 0.22 indicates a 22% probability these results occurred by chance – well above the conventional 5% threshold for statistical significance.
Broadening to include sire-line descendants yields 178 horses with 31 Black Type Performers. Despite the larger sample size, we find similar statistical metrics, and the relationship coefficients diminish notably as we move away from direct crosses, weakening the pattern’s predictive value. This illustrates a fundamental challenge in thoroughbred analysis: the gap between narrative observation and statistical validation. The multiple testing problem suggests we expect to find some successful patterns by chance. Without accounting for quality of opportunity, sample size significance, and relationship coefficients, we risk mistaking random variation for meaningful pattern.
Rather than “staring at the floor” when confronted with interesting patterns, we should ask how to correctly measure their predictive value. Through comprehensive statistical analysis, considering quality-adjusted success rates and proper confidence intervals, we can transform interesting observations into validated predictive factors. The path forward lies in proper statistical quantification within a comprehensive model that accounts for all significant variables, moving beyond simple pattern matching to true statistical proof of predictive value.